Clear the air
Improving ventilation practices in NZ
When it became clear that New Zealand’s successful elimination strategy was to be replaced with one of mitigation, it also became clear that we needed to understand the ventilation practices in our indoor spaces.
As part of the Ministry of Health fund to improve preparedness for future pandemics, my team set out to characterise the ventilation conditions of multiple indoor spaces in New Zealand. The basic idea was to visit as many indoor spaces as possible, characterise their ventilation performance while in use, provide some information and observe the potential changes to that performance.
The first challenge was that there was no off-the-shelf device that would allow us to measure all the characteristics that we wanted to observe in any indoor space. So, my first task was to develop such a system. The basic requirements were:
- Measure \(CO_2\)
- Capture the level of human activity in the space
- Observe the openning/closing of windows/doors in the space
- Provide a means of direct feedback about the quality of the air in the space
On top of these requirements, it was necessary for the system(s) to be managed centrally so that we could tweak them when needed, particularly in the feedback stage of the interventions.
Our response to this challenge was to develop SHAQS (Smart Home Air Quality System), a modular and portable system to quickly characterise the ventilation performance of indoor spaces. The heart and brain of the system is a Raspberry Pi computer running Home Assistant that receives the data transmissions form air quality sensors as well as human presence monitors and door/window opening sensors. The parameters measured are:
- Motion detection. mmWave radar (Tuya ZigBee Human Presence Detector)
- Door/Windows opening sensor. Simple Hall sensors with ZigBee connectivity (Tuya ZigBee Door Window sensor)
- Indoor air quality. The Qingping Air Monitor Lite using BlueTooth connectivity:
- CO2. Photoacoustic sensor – Sensair 41.
- PM1, PM2.5, PM10. Plantower PMS5003 laser dust sensor.
The data are streamed to an InfluxDB instance with a separate bucket for each SHAQS, as data available locally onboard of each SHAQS only covers the last 48 hours. To generate the automatic reports, we setup Batch jobs in Amazon’s cloud computing platform to run Docker images with R scripts to take the data from the InfluxDB database and generate automatic daily and weekly reports.
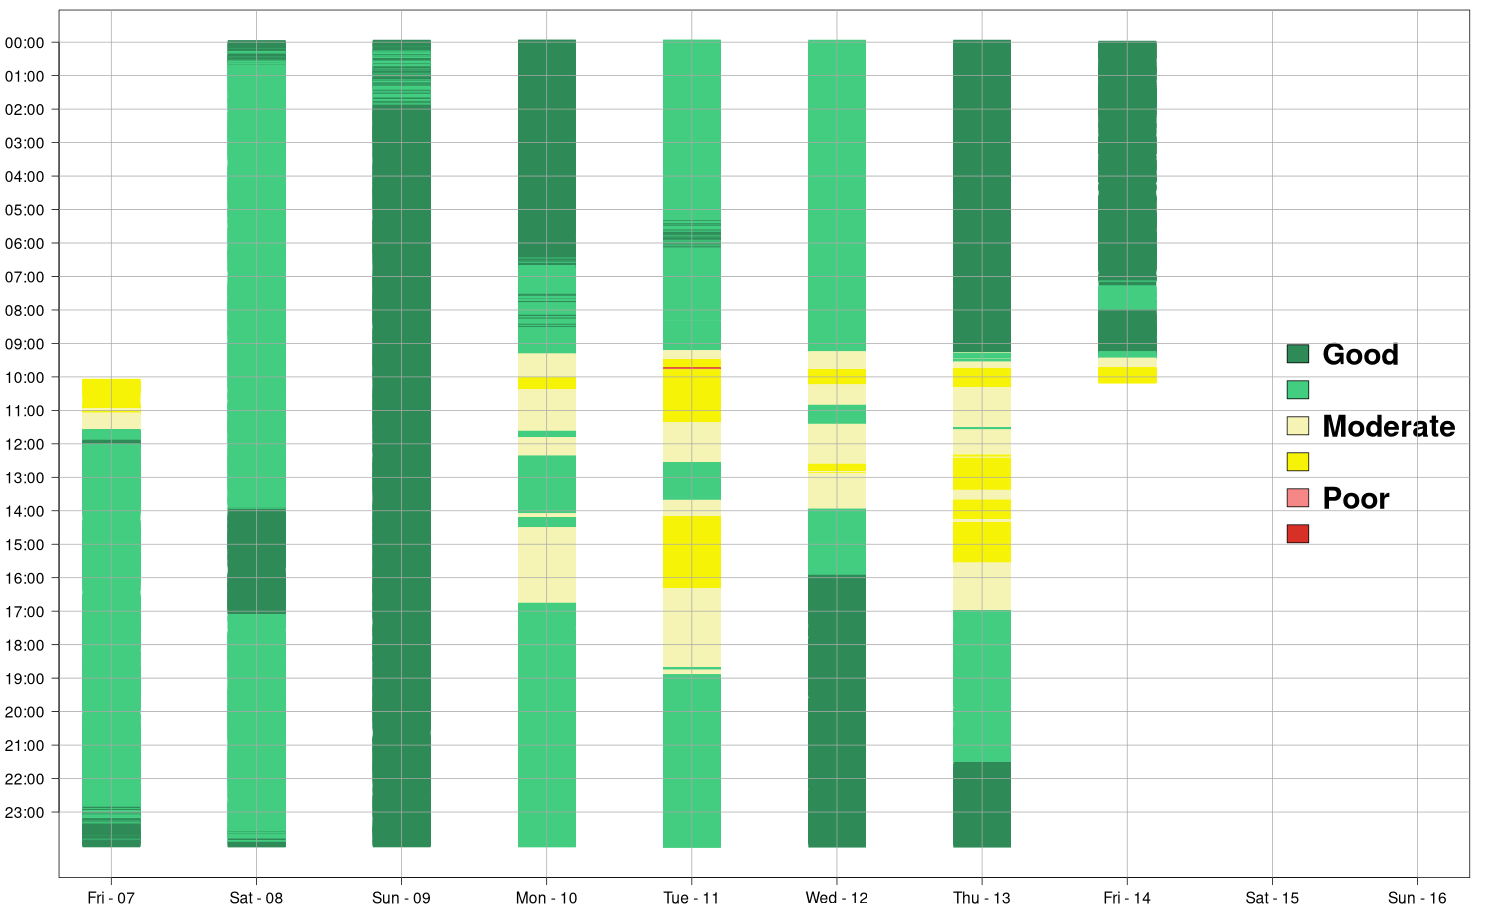
Here is a sample of a report to our participants that shows the ventilation conditions (colour scale from Good to Poor) during a week of measurements. Each vertical bar corresponds to a day, from midnight to midnight.
